
Computer Vision: Object Recognition with Transfer Learning using the Inception V3 Neural Network
How I used a state-of-the-art convolutional neural network to make a tool for classifying the content of images - and how you can too.
Computer vision is an important area of research where neural network models have remarkable success. The potential of this technology goes far beyond its highly publicized uses for self-driving vehicles and facial recognition. My interest in this area was sparked by its potential utility for people with visual impairments, and its potential as a labor-saving tool for purposes such as data collection, physical security, plant identifiation, and lab science.
Outline
In this blog post, I describe:
- How to implement a model that can identify images containing 1,000 objects with near-human accuracy.
- How to use transfer learning - a technique that harnesses the power of pre-trained neural networks for use with new datasets and problems - to train a model to classify images in categories that are not within the initial training set.
- How to assess the accuracy of a model trained with transfer learning on data it was not trained on.
This post will make more sense to readers with a solid understanding of neural networks, but even in the absence of any prior knowledge about them, if you follow along you should be able to make your own implementation of the model.
Image Recognition with a State-of-the-Art Model: Google’s Inception V3
In 2015, Google AI released a neural network built in Tensorflow called Inception V3. This is a deep learning model designed for object recognition, and its many layers are visualized below in a diagram from a Google AI blog post:
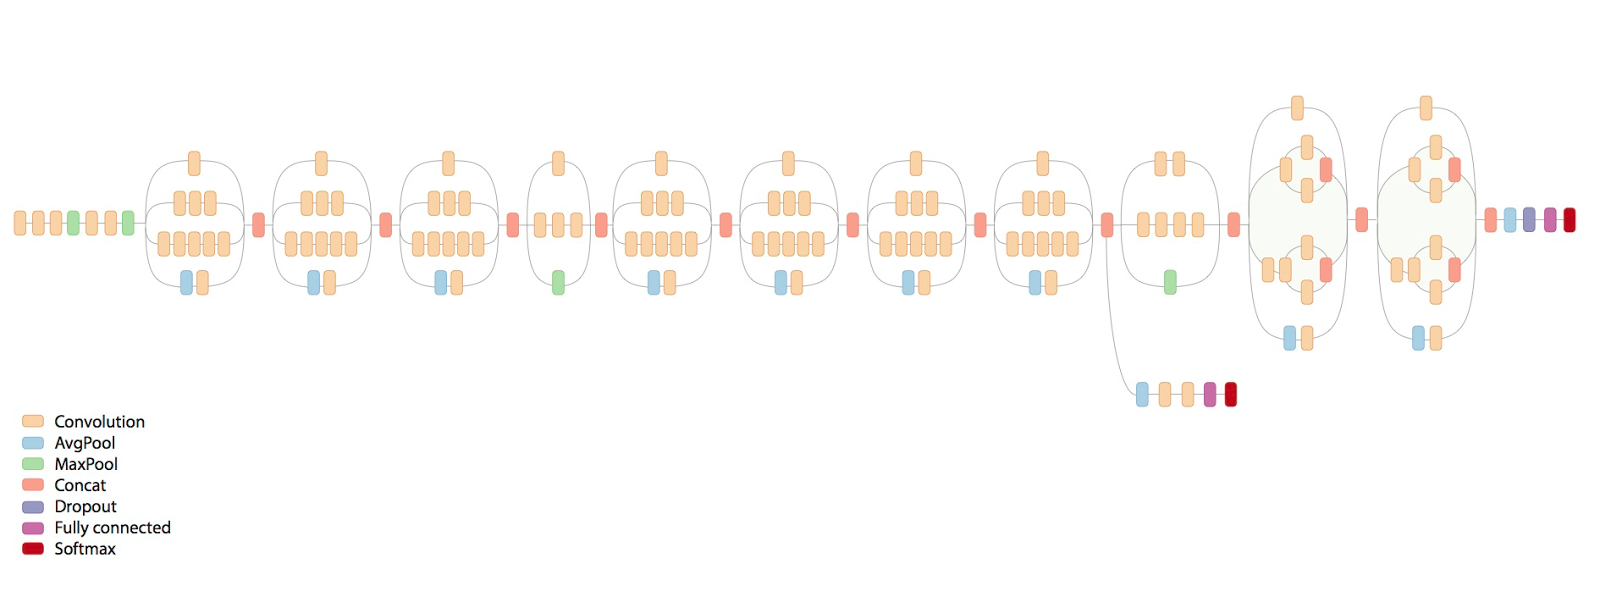
Details on the model are available in this paper. While enterprise models like this require serious computing power to train - since they have millions of parameters - once trained, they are relatively quick to use. It takes less than 2 seconds for my macbook air with 8GB of ram to predict what’s in an image using Inception V3.
The Training Data: ImageNet Database
A standard benchmark for image classification models is performance on the ImageNet database, which contains images for 1,000 categories of objects - from vehicles, to animal species, to household items - labeled such that they are suitable for training neural networks.
When trained on this data, Inception V3 achieves near-human performance on categorizing images of objects in these categories: 21.2% top-1 and 5.6% top-5 error rates. It achieves impressive performance even on visually similar objects such as closely related animal species (which most humans would struggle with).
Tutorial: Meet Inception V3
-
To implement this model in the command line, you first have to clone or download this Tensorflow Git Repo, and if you don’t have it already, install the Python programming language, and then install the tensorflow Python package by using
pip install tensorflowon your command line. -
Use your command line to navigate to the directory where you installed the Tensorflow Repo, and use the command
cd models/tutorials/image/imagenetto navigate to the imagenet subfolder. -
Run the command
python classify_image.py, to run a python script which, on first run, will download the pre-trained Inception V3 model, and subsequently is used to classify an image. The output should look like 5 lines of text, each containing a prediction for what is in an image, as well as the predicted probability of that object being present. The default image is a panda, so the first line of output when you runpython classify_image.pyshould list several synonyms for panda, as well as a “score”, close to 1, followed by 4 other predictions with scores close to 0. -
To easily classify another image, first download a .jpg into the imagenet folder which you navigated to in step 2, above. Then, if your image is called, for example,
image.jpg, use the commandpython classify_image.py --image image.jpg. After a few seconds, you should see the model’s predictions of what is in the image. If you attempt to classify an image of an object which was not within the training set, it will make a wild guess. If you’re interested in what objects are covered in the training data, check out the ImageNet documentation.
An example of what the output should look like (when the image is of a squirrel):
fox squirrel, eastern fox squirrel, Sciurus niger (score = 0.91904)
throne (score = 0.00226)
ear, spike, capitulum (score = 0.00193)
studio couch, day bed (score = 0.00129)
marmot (score = 0.00123)
As an example of the utility of a model like this - I didn’t even know that a fox squirrel was a thing, let alone that it was also called an eastern fox squirrel, etc.
Also, you have to admit its pretty hilarious that its second-place guess is a THRONE (???). Who knew that squirrels look like thrones?! Neural networks are rich with utility.
Extending the Model: Transfer Learning
Transfer learning is a technique in which we retrain just the last layer of a neural network, on data that the model was not originally trained on. In the case of image classification, this teaches the model to classify images into the categories it was retrained on, rather than the categories it was originally trained on. In this example, we will use transfer learning to retrain the Inception V3 model (which was originally trained on the ImageNet database) to classify 5 types of flowers which are not in that database.
Transfer learning works because much of the visual information which is useful for distinguishing objects in the ImageNet database is also useful for visually distinguishing between objects not in that database. The last layer of the pretrained network has a lot of information about the visual characteristics of an image. This information can be repurposed to a novel image classification task relatively easily, without our needing to retrain the other layers in the network.
Compared with training a model from scratch, this drastically reduces the amount of processing required to parameterize a neural network. It can quickly reuse the power of the enterprise-scale computing resources Google used to train Inception V3 on ImageNet for use with another image classification data set.
Tutorial: Transfer Learning to Flowers
- Install the package tensorflow-hub package from your command line with the command
pip install tensorflow-hub - Clone this repo with Git
- Download the flowers data for retraining from here, then unzip the file and put the folder containing flower photos into the “tf_files” subfolder of the newly cloned repo.
-
With your command line, navigate to the “tensorflow-for-poets-2” directory, and use the command
python scripts/retrain.py --image_dir=tf_files/flower_photos(Note this can take some time, depending on your computing setup, it took about 20 minutes on my laptop). This will start the retraining process. For more details on the process, I suggest this Tensorflow blog. - Now you can classify an image based on the type of flower it contains: roses, dandelions, tulips, sunflowers, and daisies. To classify an image, save it to the “tensorflow-for-poets-2” directory, and from that same directory, run the command
python scripts/label_image.py --image [your image file]
(If you get an error here, try opening the “label_image.py” python script in a text editor, and replacing the following code (at line 74):
input_height = 224
input_width = 224
input_mean = 128
input_std = 128
input_layer = "input"
with
input_height = 299
input_width = 299
input_mean = 0
input_std = 255
input_layer = "Mul"
(Credit for this fix goes to Sagar Sharma on his blog))
Assessing the Model
Checking Model Accuracy on Training Data with Tensorflow Dashboard
During each step of model retraining, information is saved about the model’s performance on training and testing sets. This data can be accessed using the built in Tensorflow dashboard by using the command --logdir /tmp/retrain_logs from the same directory, then going to “localhost:6006” in your web browser. This displays graphs of the training and test accuracy and cross_entropy, as well as summary statistics about the training process. With the advantage of being easy to see, these graphs aren’t very customizable (e.g. they don’t come with axis labels). For example, this graph shows my implementation’s accuracy on the y-axis, and number of training steps on the x-axis, with the train set in orange, and test set in blue:

Assessing Model Accuracy on Novel Data
After retraining, I wanted to check how accurate the models predictions were with novel data. Do they match up to the Tensorflow dashboard’s assessment of model performance? To do that, first I found 100 images that I wanted to test my model on (I got 20 for each type of flower that the model classifies). Next, I saved the model’s predictions for each photo to a text file so that I could read them into a Pandas dataframe and analyze the results. Of course, I looked at 1st-guess accuracy rather than top 5 accuracy, since there were only 5 flowers.
To save the predictions to text files I:
-
Made a directory to save the text files with predictions (called “predictions”):
mkdir predictions -
Created a text file for each image with its predictions, and saved them in the new “predictions” directory:
for i in *.jpeg; do touch $i>>predictions/${i} ; python scripts/label_image.py --image ${i} >>predictions/${i};done(The text files are included in this repo, so the below code will work if you change the path in thewith openstatement in the next cell to match your path.) -
Used the Python code below to read those files into a dataframe, and to calculate the model’s accuracy on the new data.
# Import packages for making a list of results and doing stats on them
import pandas as pd
import numpy as np
from os import listdir

# Make a dataframe to put results into
results = pd.DataFrame()
# For each .txt file, read the file, then
# (Using 'with' so that the file connection is explicitly closed and doesn't waste memory)
for i in range(100):
    with open('tensorflow-for-poets-2/predictions/'+str(i+1)+'.txt', 'r') as myfile:
        data=myfile.read()
    # Get the third line of the text file (the one that contains the 1st guess and its probability)
    line = data.splitlines()[3]
    # Split the line into the guess (a flower name), and the probability associated with that guess
    guess, prob = line.split(' ')
    # Save just the probabilities as prob,
    prob = prob[7:14]
    # Make a list for each result to add to dataframe [TRUE, GUESS, PROB]
    result = []
    if (i<20):
        result.append("roses")
    elif (i<40):
        result.append("daisy")
    elif (i<60):
        result.append("sunflowers")
    elif (i<80):
        result.append("tulips")
    elif (i<100):
        result.append("dandelion")
    result.append(guess)
    result.append(prob)
    # Add result list to results dataframe as a row
    results = results.append(pd.Series(result), ignore_index=True)
# Set the column names for the dataframe.
results.columns=["TRUE","GUESS","PROB"]
# Here are the raw 1st-guess results. From looking at them I can see that it looks like
# the higher the probability guesses are more likely to be correct, below I'll check if this is true.
results
| TRUE | GUESS | PROB | |
|---|---|---|---|
| 0 | roses | roses | 0.99838 |
| 1 | roses | roses | 0.99909 |
| 2 | roses | tulips | 0.50432 |
| 3 | roses | roses | 0.90015 |
| 4 | roses | roses | 0.99985 |
| 5 | roses | roses | 0.68499 |
| 6 | roses | roses | 0.99164 |
| 7 | roses | roses | 0.97963 |
| 8 | roses | roses | 0.99070 |
| 9 | roses | roses | 0.96547 |
| 10 | roses | roses | 0.91399 |
| 11 | roses | roses | 0.99728 |
| 12 | roses | roses | 0.58895 |
| 13 | roses | roses | 0.99353 |
| 14 | roses | roses | 0.90395 |
| 15 | roses | roses | 0.95844 |
| 16 | roses | roses | 0.99550 |
| 17 | roses | roses | 0.87966 |
| 18 | roses | roses | 0.95102 |
| 19 | roses | roses | 0.43015 |
| 20 | daisy | daisy | 0.99869 |
| 21 | daisy | daisy | 0.99722 |
| 22 | daisy | daisy | 0.95584 |
| 23 | daisy | daisy | 0.99685 |
| 24 | daisy | daisy | 0.97863 |
| 25 | daisy | daisy | 0.99581 |
| 26 | daisy | daisy | 0.98614 |
| 27 | daisy | daisy | 0.99263 |
| 28 | daisy | daisy | 0.99237 |
| 29 | daisy | daisy | 0.99663 |
| ... | ... | ... | ... |
| 70 | tulips | tulips | 0.98159 |
| 71 | tulips | tulips | 0.98490 |
| 72 | tulips | tulips | 0.98343 |
| 73 | tulips | tulips | 0.73029 |
| 74 | tulips | tulips | 0.98601 |
| 75 | tulips | tulips | 0.99994 |
| 76 | tulips | tulips | 0.85979 |
| 77 | tulips | tulips | 0.99889 |
| 78 | tulips | tulips | 0.78120 |
| 79 | tulips | tulips | 0.83099 |
| 80 | dandelion | dandelion | 0.99846 |
| 81 | dandelion | dandelion | 0.82417 |
| 82 | dandelion | dandelion | 0.77323 |
| 83 | dandelion | dandelion | 0.99918 |
| 84 | dandelion | dandelion | 0.92918 |
| 85 | dandelion | dandelion | 0.79090 |
| 86 | dandelion | dandelion | 0.92945 |
| 87 | dandelion | dandelion | 0.77649 |
| 88 | dandelion | dandelion | 0.99965 |
| 89 | dandelion | dandelion | 0.92160 |
| 90 | dandelion | sunflowers | 0.62876 |
| 91 | dandelion | sunflowers | 0.44857 |
| 92 | dandelion | dandelion | 0.99073 |
| 93 | dandelion | sunflowers | 0.40913 |
| 94 | dandelion | dandelion | 0.85730 |
| 95 | dandelion | dandelion | 0.99124 |
| 96 | dandelion | dandelion | 0.98067 |
| 97 | dandelion | dandelion | 0.99913 |
| 98 | dandelion | dandelion | 0.69952 |
| 99 | dandelion | dandelion | 0.99212 |
100 rows × 3 columns
# /Manually/ make a confusion matrix to assess the model

# Finding the number of true guesses for each flower, and the number of incorrect guesses for each flower
def confusion_per_flower(flower):
    # Instantiate counters for each kind of possible guess
    rose_guesses = 0
    daisy_guesses = 0
    sunflower_guesses = 0
    tulip_guesses = 0
    dandelion_guesses = 0
    guess_list = []
    # For the rows where the TRUE flower value is the same as the flower parameter, count the number of guesses of each type
    for i in range(100):
        if (results.TRUE[i] == flower):
            if (results.GUESS[i] == 'roses'):
                rose_guesses += 1
            elif (results.GUESS[i] == 'daisy'):
                daisy_guesses += 1
            elif (results.GUESS[i] == 'sunflowers'):
                sunflower_guesses += 1
            elif (results.GUESS[i] == 'tulips'):
                tulip_guesses += 1
            elif (results.GUESS[i] == 'dandelion'):
                dandelion_guesses += 1
    # Add the counts to the guess_list instantiated above
    guess_list.append(rose_guesses)
    guess_list.append(daisy_guesses)
    guess_list.append(sunflower_guesses)
    guess_list.append(tulip_guesses)
    guess_list.append(dandelion_guesses)

    return guess_list

# Set up a dataframe to hold the confusion matrix
cm = pd.DataFrame()

# make a list of flower names to use the function on
flower_names = ['roses', 'daisy', 'sunflowers', 'tulips', 'dandelion']

# use the function on each flower and add the results to the dataframe
for i in flower_names:
    cm = cm.append(pd.Series(confusion_per_flower(i)), ignore_index=True)
cm
| 0 | 1 | 2 | 3 | 4 | |
|---|---|---|---|---|---|
| 0 | 19.0 | 0.0 | 0.0 | 1.0 | 0.0 |
| 1 | 0.0 | 19.0 | 0.0 | 1.0 | 0.0 |
| 2 | 0.0 | 2.0 | 18.0 | 0.0 | 0.0 |
| 3 | 0.0 | 0.0 | 0.0 | 20.0 | 0.0 |
| 4 | 0.0 | 0.0 | 3.0 | 0.0 | 17.0 |
# rename the columns to represent the flower names
cm.columns=flower_names
# count the correct and incorrect guesses per flower and save them in a
# summary confusion matrix
summary_cm = pd.DataFrame({'roses': 19, 'daisy': 19,'sunflowers': 18, 'tulips' : 20, 'dandelion' : 17},index = ['True','False'])
summary_cm.iloc[1]=({'roses': 1, 'daisy': 1,'sunflowers': 2, 'tulips' : 0, 'dandelion' : 3})
# show confusion matrix
summary_cm
| daisy | dandelion | roses | sunflowers | tulips | |
|---|---|---|---|---|---|
| True | 19 | 17 | 19 | 18 | 20 |
| False | 1 | 3 | 1 | 2 | 0 |
The table above shows how accurate the model’s predictions were for different flower types.
#calculate accuracy
Accuracy = pd.Series([19/20,17/20,19/20,18/20,20/20]).mean()
Accuracy
0.93
# Overall, the accuracy on the novel photos was 93%. Not bad!